Google Cloud plugin
The Google Cloud plugin provides integrations with Google Cloud Platform services for Genkit.
Features
Section titled “Features”- Google Cloud Observability: Exports telemetry (traces, metrics) and logs to Google Cloud’s operations suite.
- Model Armor: Middleware for sanitizing user prompts and model responses using Google Cloud Model Armor (Node.js only).
Set up a Google Cloud account
Section titled “Set up a Google Cloud account”This plugin requires a Google Cloud account (sign up if you don’t already have one) and a Google Cloud project.
Prior to adding the plugin, make sure that the following APIs are enabled for your project:
These APIs should be listed in the API dashboard for your project.
Click here to learn more about enabling and disabling APIs.
Note: Logging is facilitated by the slog package
in favor of the OpenTelemetry logging APIs. Export
of logs is done via a dedicated Google Cloud exporter.
Prerequisites
Section titled “Prerequisites”If you want to locally run flows that use this plugin, you need the Google Cloud CLI tool installed.
Configuration
Section titled “Configuration”To enable exporting to Google Cloud Tracing and Monitoring, import the
googlecloud package and call EnableGoogleCloudTelemetry(). After calling this function, your telemetry
gets automatically exported.
import "github.com/firebase/genkit/go/plugins/googlecloud"googlecloud.EnableGoogleCloudTelemetry(&googlecloud.GoogleCloudTelemetryOptions{ ProjectID: "your-google-cloud-project",})You must specify the Google Cloud project to which you want to export telemetry data (if it cannot be auto-detected). There are also some optional parameters:
-
ProjectID: Your Google Cloud project ID. -
ForceDevExport: Export telemetry data even when running in a dev environment (such as when usinggenkit startorgenkit flow:run). This is a quick way to test your integration and send your first events for monitoring in Google Cloud.If you use this option, you also need to make your Cloud credentials available locally:
gcloud auth application-default loginMetricExportIntervalMillis: The interval (in milliseconds) at which to export telemetry information. By default, this is 5000 in dev and 300000 in prod.DisableMetrics: Iftrue, metrics are not exported.DisableTraces: Iftrue, traces are not exported.DisableLoggingInputAndOutput: Iftrue, disables PII redaction and preserves inputs/outputs in traces and logs.
The plugin requires your Google Cloud project credentials. If you’re running your flows from a Google Cloud environment (Cloud Run, etc), the credentials are set automatically. Running in other environments requires setting up Application Default Credentials.
Production monitoring via Google Cloud’s operations suite
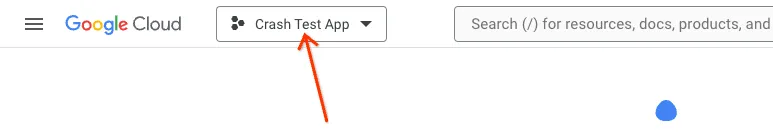
Section titled “Production monitoring via Google Cloud’s operations suite”Once a flow is deployed, navigate to Google Cloud’s operations suite and select your project.
Logs and traces
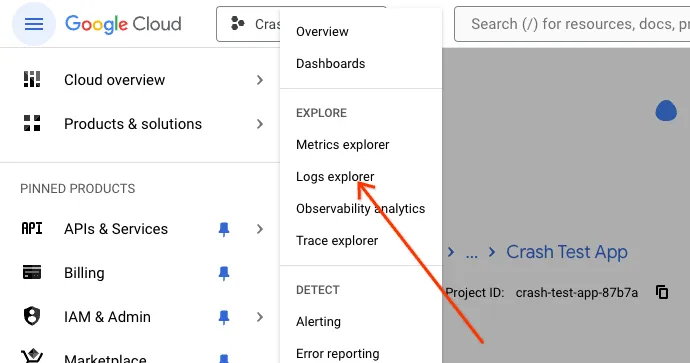
Section titled “Logs and traces”From the side menu, find ‘Logging’ and click ‘Logs explorer’.
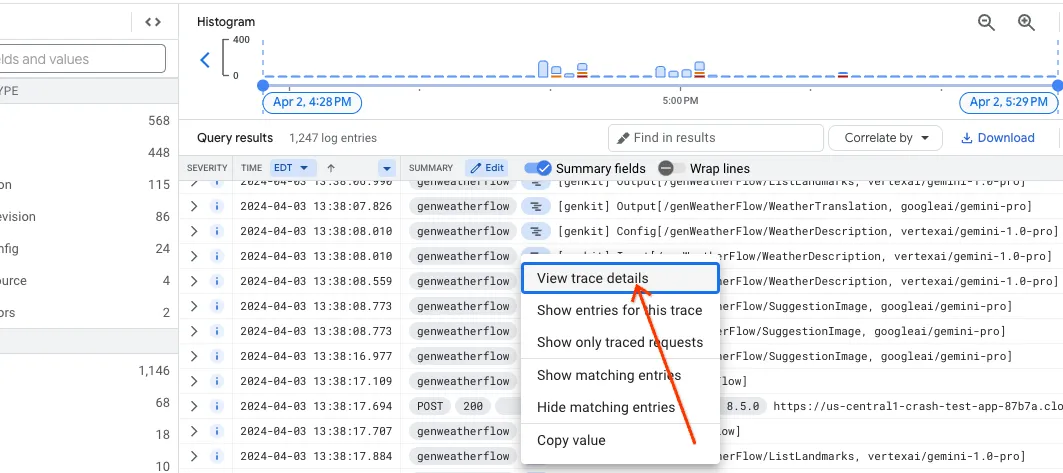
You will see all logs that are associated with your deployed flow, including console.log(). Any log which has the prefix [genkit] is a Genkit-internal log that contains information that may be interesting for debugging purposes. For example, Genkit logs in the format Config[...] contain metadata such as the temperature and topK values for specific LLM inferences. Logs in the format Output[...] contain LLM responses while Input[...] logs contain the prompts. Cloud Logging has robust ACLs that allow fine grained control over sensitive logs.
For specific log lines, it is possible to navigate to their respective traces by clicking on the extended menu ![]() icon and selecting “View in trace details”.
icon and selecting “View in trace details”.
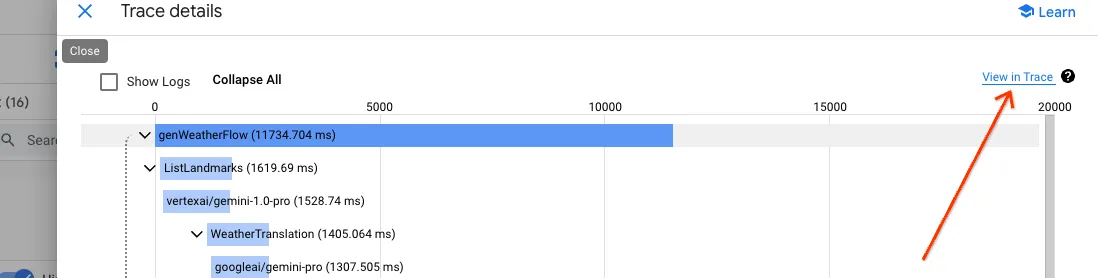
This will bring up a trace preview pane providing a quick glance of the details of the trace. To get to the full details, click the “View in Trace” link at the top right of the pane.
The most prominent navigation element in Cloud Trace is the trace scatter plot. It contains all collected traces in a given time span.
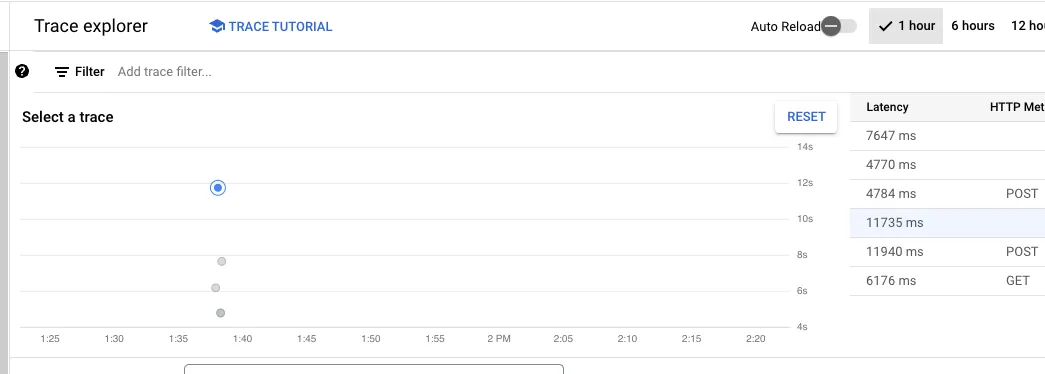
Clicking on each data point will show its details below the scatter plot.
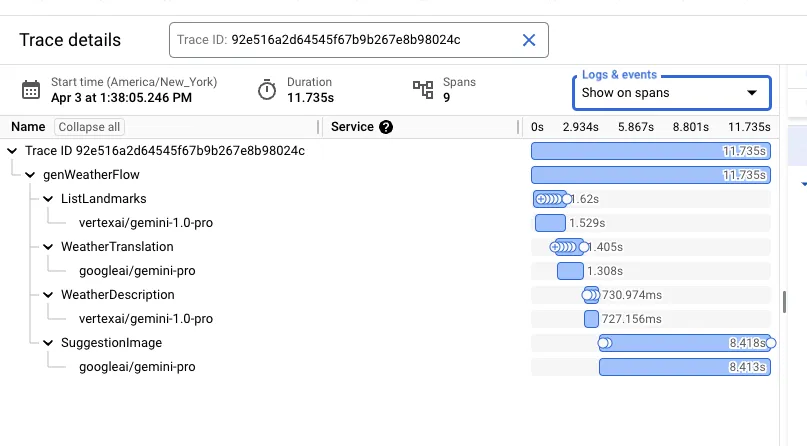
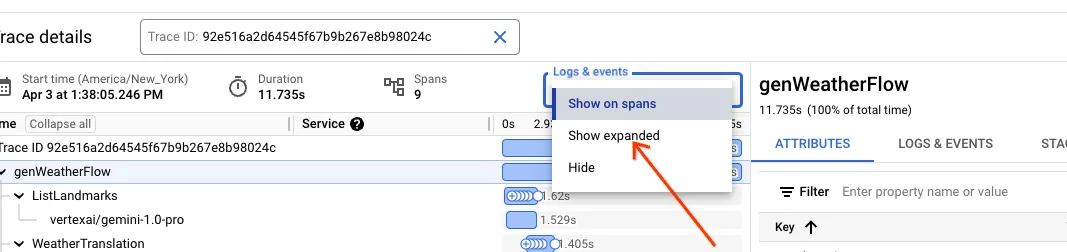
The detailed view contains the flow shape, including all steps, and important timing information. Cloud Trace has the ability to interleave all logs associated with a given trace within this view. Select the “Show expanded” option in the “Logs & events” drop down.
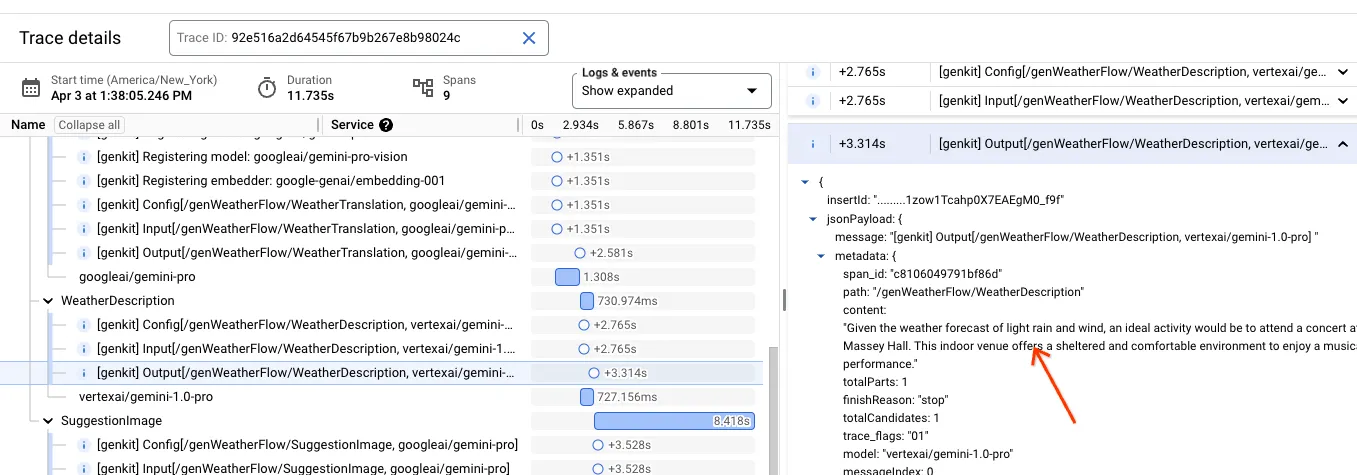
The resultant view allows detailed examination of logs in the context of the trace, including prompts and LLM responses.
Metrics
Section titled “Metrics”Viewing all metrics that Genkit exports can be done by selecting “Logging” from the side menu and clicking on “Metrics management”.
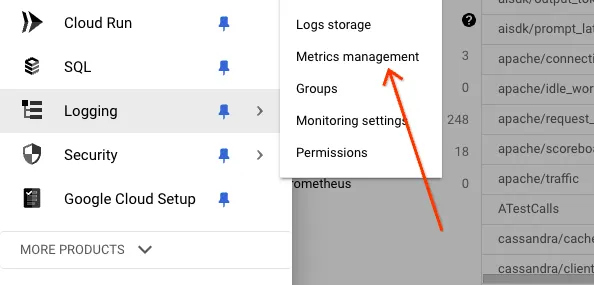
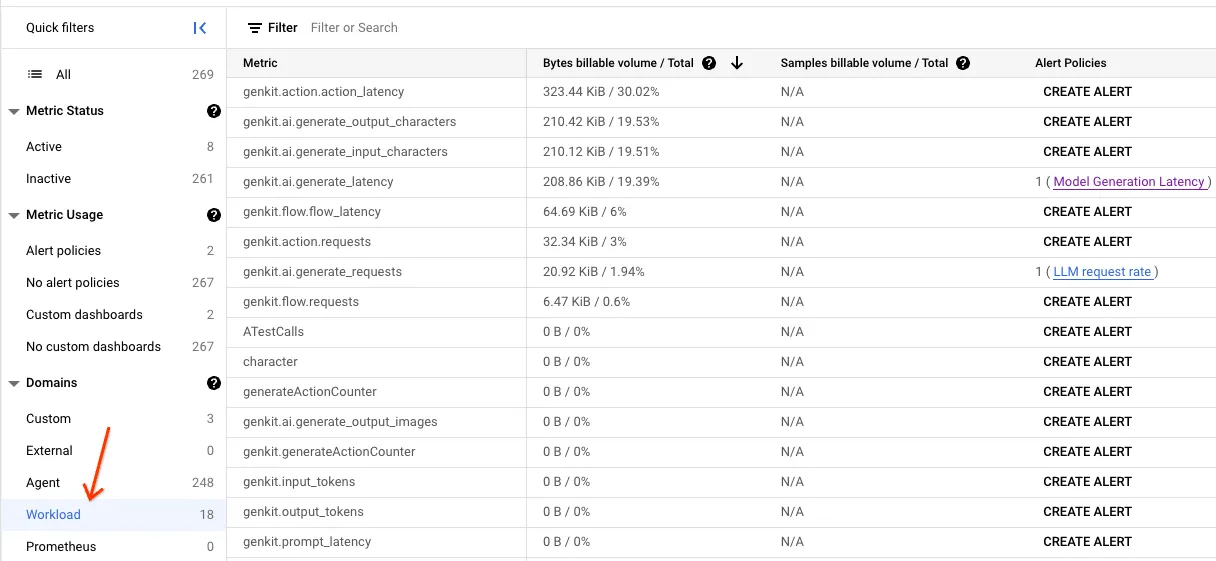
The metrics management console contains a tabular view of all collected metrics, including those that pertain to Cloud Run and its surrounding environment. Clicking on the ‘Workload’ option will reveal a list that includes Genkit-collected metrics. Any metric with the genkit prefix constitutes an internal Genkit metric.
Genkit collects several categories of metrics, including flow-level, action-level, and generate-level metrics. Each metric has several useful dimensions facilitating robust filtering and grouping.
Common dimensions include:
flow_name- the top-level name of the flow.flow_path- the span and its parent span chain up to the root span.error_code- in case of an error, the corresponding error code.error_message- in case of an error, the corresponding error message.model- the name of the model.temperature- the inference temperature value.topK- the inference topK value.topP- the inference topP value.
Flow-level metrics
Section titled “Flow-level metrics”| Name | Dimensions |
|---|---|
| genkit/flow/requests | flow_name, error_code, error_message |
| genkit/flow/latency | flow_name |
Action-level metrics
Section titled “Action-level metrics”| Name | Dimensions |
|---|---|
| genkit/action/requests | flow_name, error_code, error_message |
| genkit/action/latency | flow_name |
Generate-level metrics
Section titled “Generate-level metrics”| Name | Dimensions |
|---|---|
| genkit/ai/generate | flow_path, model, temperature, topK, topP, error_code, error_message |
| genkit/ai/generate/input_tokens | flow_path, model, temperature, topK, topP |
| genkit/ai/generate/output_tokens | flow_path, model, temperature, topK, topP |
| genkit/ai/generate/input_characters | flow_path, model, temperature, topK, topP |
| genkit/ai/generate/output_characters | flow_path, model, temperature, topK, topP |
| genkit/ai/generate/input_images | flow_path, model, temperature, topK, topP |
| genkit/ai/generate/output_images | flow_path, model, temperature, topK, topP |
| genkit/ai/generate/latency | flow_path, model, temperature, topK, topP, error_code, error_message |
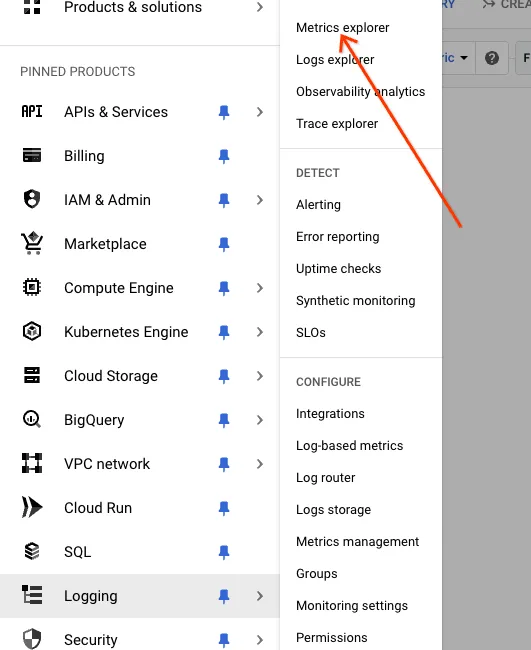
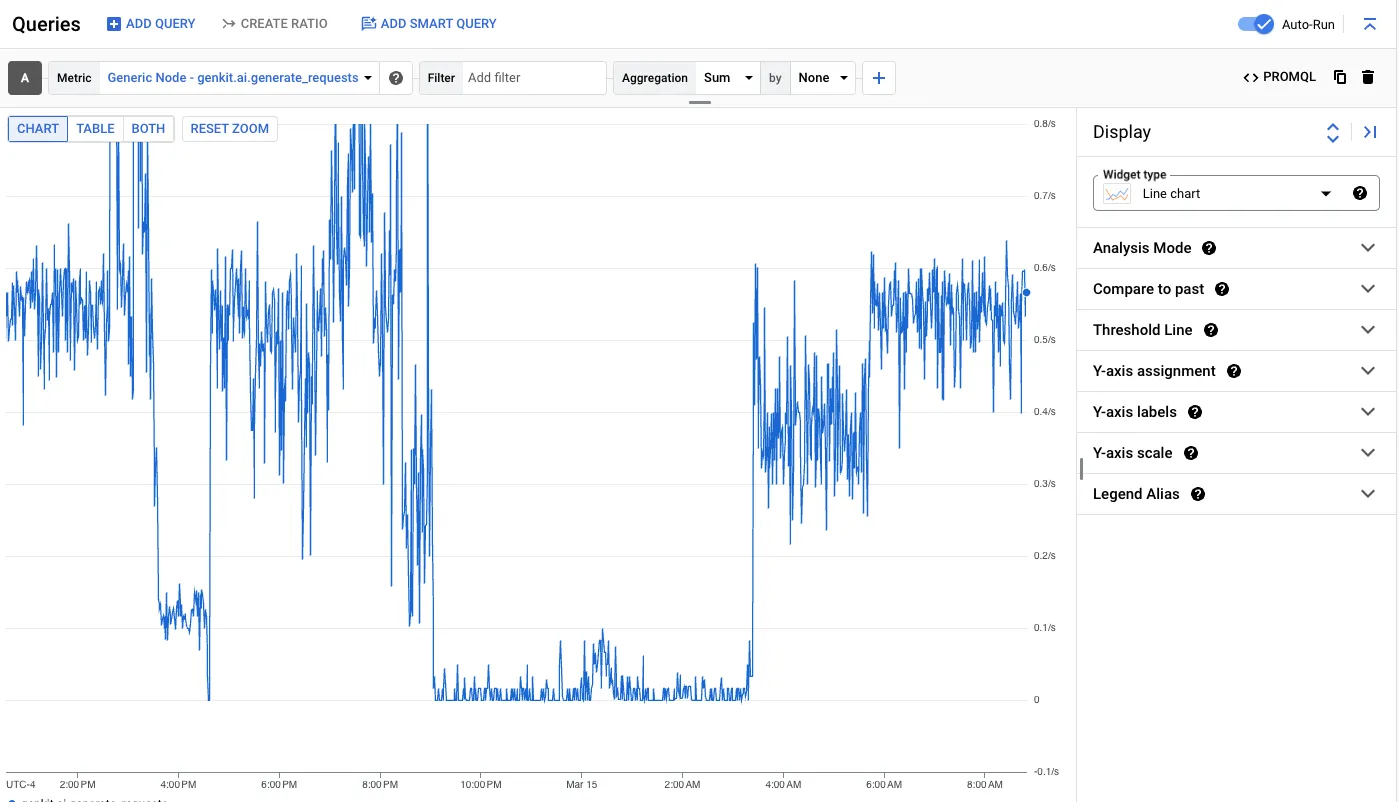
Visualizing metrics can be done through the Metrics Explorer. Using the side menu, select ‘Logging’ and click ‘Metrics explorer’
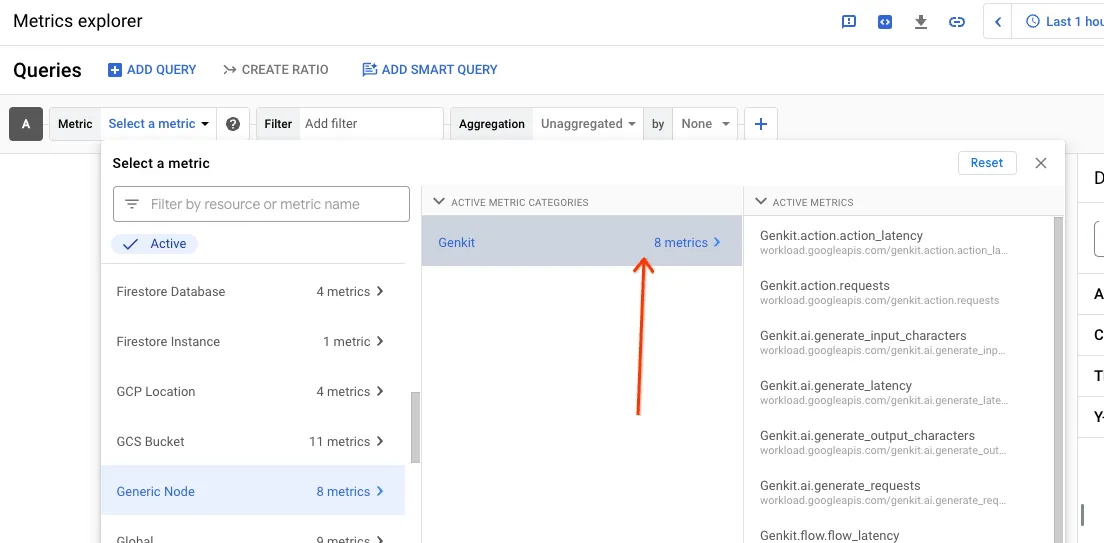
Select a metrics by clicking on the “Select a metric” dropdown, selecting ‘Generic Node’, ‘Genkit’, and a metric.
The visualization of the metric will depend on its type (counter, histogram, etc). The Metrics Explorer provides robust aggregation and querying facilities to help graph metrics by their various dimensions.
Telemetry Delay
Section titled “Telemetry Delay”There may be a slight delay before telemetry for a particular execution of a flow is displayed in Cloud’s operations suite. In most cases, this delay is under 1 minute.
Quotas and limits
Section titled “Quotas and limits”There are several quotas that are important to keep in mind:
- Cloud Trace Quotas
- 128 bytes per attribute key
- 256 bytes per attribute value
- Cloud Logging Quotas
- 256 KB per log entry
- Cloud Monitoring Quotas
Cloud Logging, Cloud Trace, and Cloud Monitoring have generous free tiers. Specific pricing can be found at the following links: